Executive Summary
Markets rallied in January as investors turned optimistic that inflation may be abating, the US Federal Reserve may soon pause its campaign of raising interest rates, and the economy has remained relatively resilient. In other words, the medicine is working, the dosage is nearly correct, and the side effects aren’t too severe.
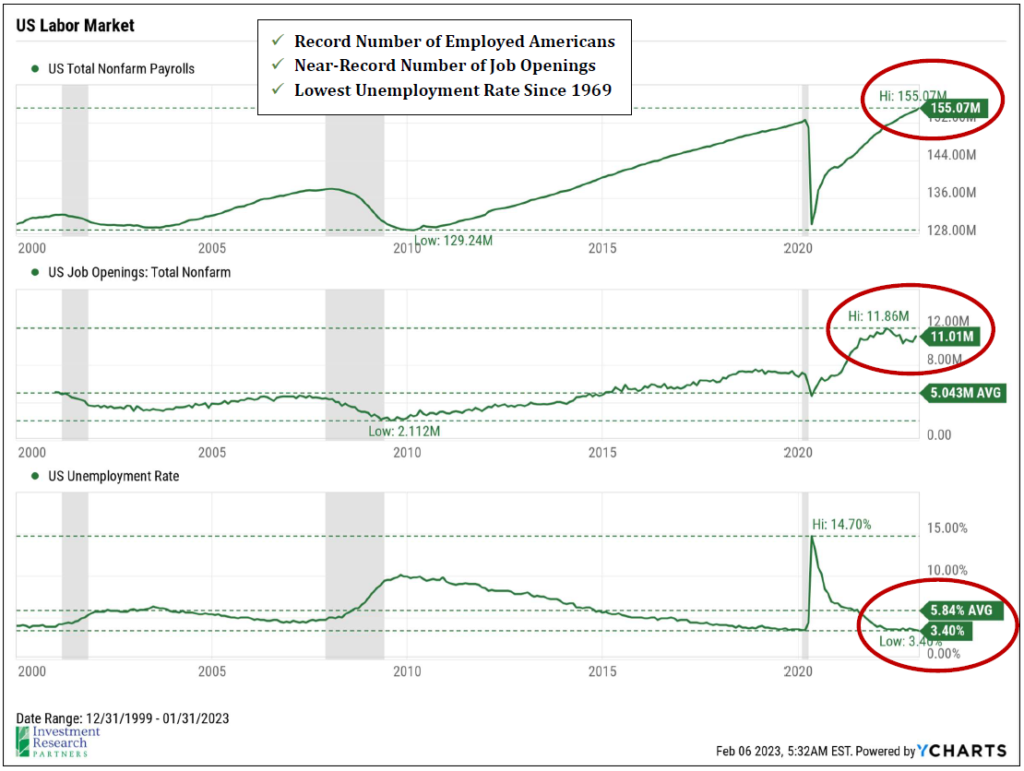
One Chart You Need: The Unstoppable Jobs Market
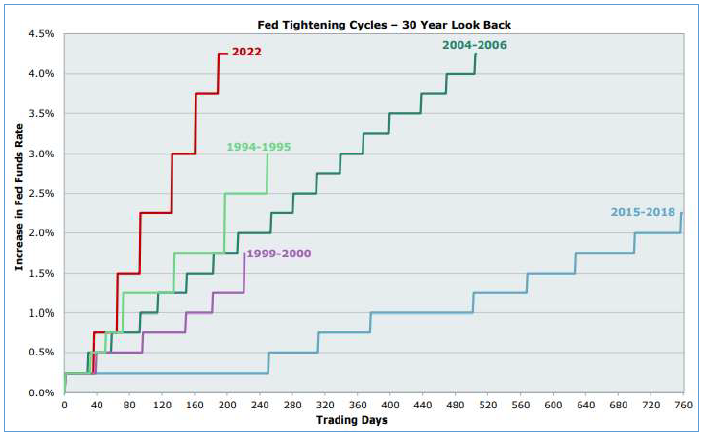
January provided a much-needed breath of fresh optimism in markets. Large US companies in the S&P 500 index gained six percent as investors looked for signs that inflationary pressures may be waning without too much deterioration to the health of the US economy. For his part, Federal Reserve Chair, Jerome Powell, largely confirmed investor suspicions during his press conference in early February. As expected, the institution raised short-term lending rates to 4.50- 4.75%, but at a much slower pace that most of 2023. He said things like, “we can say for the first time that the disinflationary process has started. This is a good thing.” And the official Committee statement was changed from considering factors that might affect how the Committee approaches “determining the pace of future increases” to “determining the extend of future increases.” In other words, the Fed is finally acknowledging that the medicine is working, they believe that the dosage is close to correct, and they are now debating how long the course of treatment should last. Investors have been worried that the medicine will cause series side effects to the patient (a nasty recession), but those fears have been abating somewhat.
The Fed’s goals are to balance price stability and full employment. Note that making stock prices go up is not in their mandate. They seek to promote economic stability, not stock market stability. In fact, we may be stuck in a counterintuitive loop for some period of time where good news is bad news and vice versa. When stock prices go up, people feel wealthier, and they spend more, which pushes up prices (inflation) and makes the Fed’s job of dampening inflation more difficult. A record breaking jobs market shows economic resiliency to the Fed’s inflation fighting medicine, but a scarcity of workers pushes up wages (inflation) and makes the Fed’s job harder.
But, this labor market may be built differently than those of past interest rate hiking cycles. Chair Powell noted during his press conference that the Fed was encouraged that inflation was easing without much strain on employment. We suspect that one positive and lasting impact of the pandemic has been the reduced frictions attributable to the ability to work remotely. For many, a change in employment, whether voluntary or not, may no longer mean the disruption of moving.
Households remain in reasonably good shape, on average. The percentage of income the average family spends on servicing debt is near a 25-year low, likely thanks to refinancing mortgages at ultra-low rates over the last few years. Credit card debt has ticked higher and savings / spending have ticked lower, but no meaningful signs of stress yet, likely due to robust employment.
On the earnings front, large US companies as measured by the S&P 500 index, as a group, are expected to have earned 3-4% more in 2022 than 2021, and 2023 is expected to be 3-4% higher than the preceding year as well. Expectations have come down significantly, which may present a lower bar for upside surprises this year. And, its notable that companies like American Express, General Motors, and Starbucks all reported that they aren’t seeing meaningful signs of slowing demand or recession. Nevertheless, more and more companies struck a cautionary tone about 2023 as slowing growth presents a host of uncertainties.
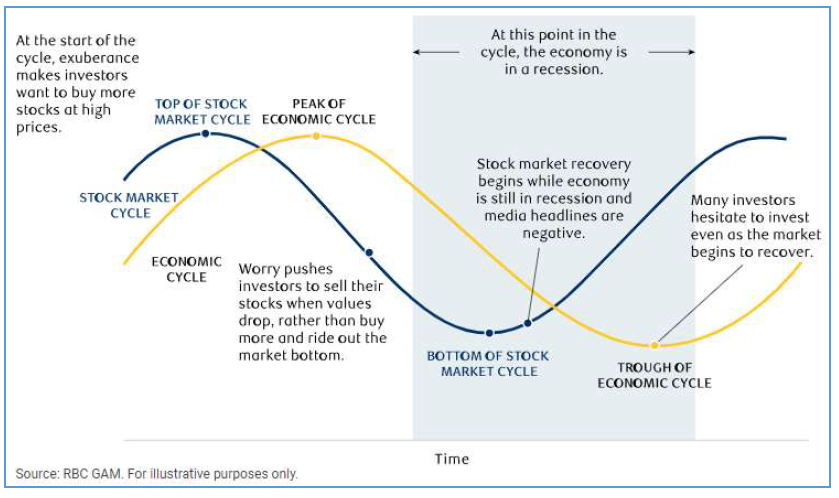
Harvard Economist, Paul Samuelson, famously quipped that, “the stock market has predicted nine of the last five recessions.” It seems that the consensus expectation among economists and market participants is that the US economy will enter a recession in 2023. Markets tend to look forward, so whether we face a recession this year or not, it wouldn’t be surprising to see a recovery continue to take shape, not without volatility, as 2023 is fully reflected in current prices, and investors begin to look toward 2024 and beyond.
Outlook & Positioning Summary
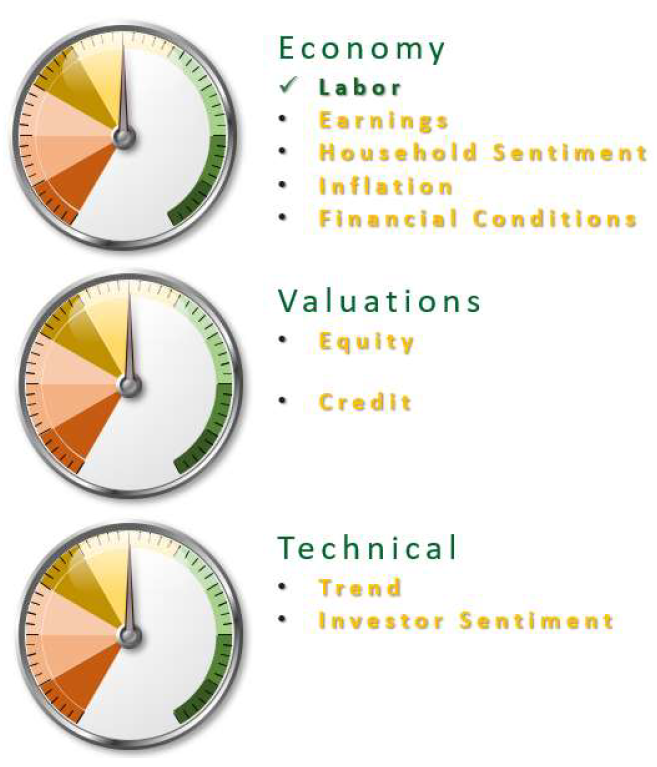
Economy
The US labor market has been a key pillar of strength that is likely supporting household confidence in spending as well.
Inflation has begun to show signs of softening (notably home and energy prices), which has led to an easing of current and expected future financial conditions.
Valuation
Stocks and bonds, on average, appear fairly valued today, but beneath the surface there may be many pockets of opportunity created by violent upheaval in markets during 2022.
Technical
Stocks have attempted to re-enter a long-term uptrend multiple times since mid-2022, but none have yet proven sustainable, at least not for large cap US stocks.
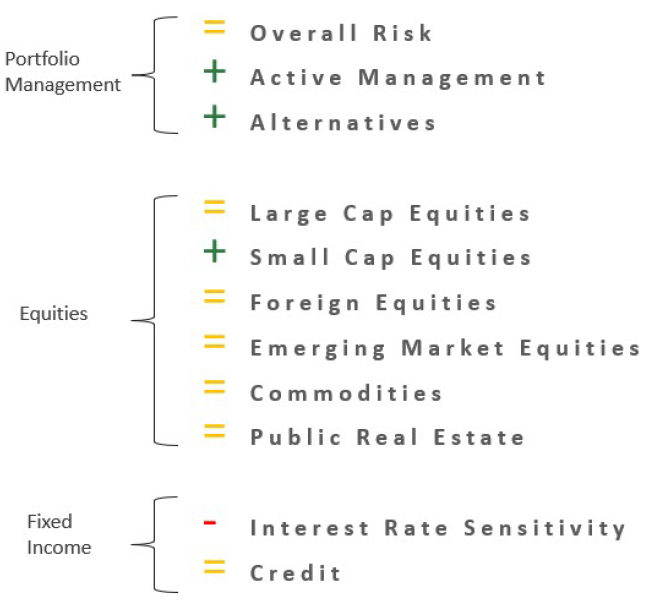
Positioning
Overall risk versus targets neutral as markets do not appear overly cheap or expensive and economy may be entering a “muddle through” period.
Favor active management and flexible alternative strategies as market volatility may have created pockets of opportunity beneath the surface.
Overweight US small cap stocks as recession fears may be overblown.
Remain cautious on interest rate sensitive investments while Fed continues to increase interest rates, but actively working now to reduce past underweight that has benefitted portfolios in 2022.
Prices & Interest Rates
| Representative Index | Jan 2023 | Year-End 2022 |
|---|---|---|
| Crude Oil (US WTI) | $78.87 | $80.26 |
| Gold | $1,930 | $1,819 |
| US Dollar | 102.10 | 103.52 |
| 2 Year Treasury | 4.21% | 4.41% |
| 10 Year Treasury | 3.52% | 3.88% |
| 30 Year Treasury | 3.65% | 3.97% |
Asset Class Returns
| Category | Representative Index | Jan 2023 | 1 Year | 3 Years | 5 Years |
|---|---|---|---|---|---|
| US Large Cap Equity | S&P 500 | 6.3% | -8.4% | 9.9% | 9.5% |
| US Large Cap Equity | Dow Jones Industrial Average | 2.9% | -0.9% | 8.7% | 7.8% |
| US All Cap Equity | Russell 3000 Growth | 8.4% | -15.5% | 9.5% | 10.8% |
| US All Cap Equity | Russell 3000 Value | 5.4% | -0.4% | 8.6% | 6.9% |
| US Small Cap Equity | Russel 2000 | 9.8% | -3.4% | 7.5% | 5.5% |
| Global Equity | MSCI All-Country World | 7.2% | -8.0% | 6.8% | 5.5% |
| Global Equity | MSCI All-Country World ESG Leaders | 7.4% | -9.1% | 6.6% | 5.8% |
| Foreign Developed Equity | MSCI EAFE | 8.1% | -2.8% | 4.3% | 2.1% |
| Emerging Market Equity | MSCI Emerging Markets | 7.9% | -12.1% | 1.4% | -1.5% |
| US Fixed Income | Bloomberg Barclays US Agg. Bond | 3.1% | -8.4% | -2.4% | 0.9% |
| US Fixed Income | Bloomberg Barclays Municipal Bond | 2.9% | -3.3% | -0.4% | 2.1% |
| Global Fixed Income | Bloomberg Barclays Global Agg. Bond | 3.3% | -11.7% | -3.9% | -1.3% |


